27 Apr From plant to plate: The journey of a pepper
To mark Stop Food Waste Day 2021, we follow the journey a pepper takes to get to our plates and looks at where the waste typically occurs along the way.

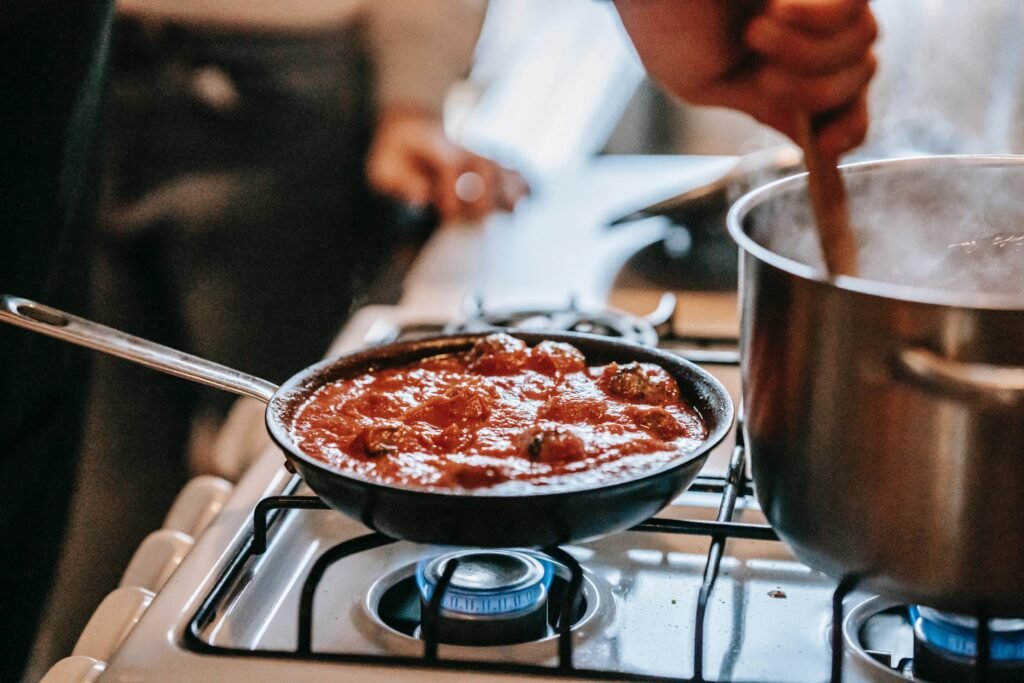
The pot on my stove is bubbling up and my kitchen starts to smell like summer. I’m making a sauce to use up some peppers that started looking a bit mushy.
I don’t want to let them spoil, after all, I worked hard to grow them – I carried and poured buckets of compost over the soil, raked it, pruned them, watered them, protected them from pests, and patiently waited for them to grow, before picking them, cleaning them up and biking them home from my shared garden.
Now, if you consider the effort it took me to grow, harvest, process, and transport this pepper, and scale it to industrial production, and multiply it by all the peppers in stores, all over the world, every day of the week… that’s a lot of peppers, and a lot of energy consumed to get them there, ripe and ready to eat.
In fact, it takes on average about 7 units of fossil fuel to produce 1 unit of food. And yet, in Canada, more than two-thirds of the food produced is not eaten. Two thirds.
When food is wasted, all the resources poured into its production, packaging, transportation, and distribution are wasted with it, generating unnecessary greenhouse gas emissions, using up water and land.
The further down the chain the food waste occurs, the more resources are wasted getting it to that stage.
What is the energy required to get this pepper to the table, and what are the avoidable causes of food loss and waste? Let’s take a closer look at its journey through its entire life cycle and figure out what’s happening at each stage.

Agricultural production at a large scale, combined with the pressure to continuously increase crop yield, represents about 20% of the total energy input in the food supply chain.
That includes tractors and machinery, irrigation, inorganic fertilizers (particularly nitrogen-based fertilizers which require an enormous amount of energy to produce), heated greenhouses, and refrigerated storage.
At that stage, our pepper has to make it through its first challenges. It has to get picked up in the first place, as many factors such as overplanning, high harvest costs, low market prices, low consumer demand or lack of seasonal workers can all result in leaving produce on the field.
It also has to look perfect to avoid being rejected due to high cosmetic standards. 6% will not make it to the next stage because of those avoidable reasons.
Next up, processing and packaging, which contributes to 23% of the total energy used in our food system. It involves drying, cooling and heating, transforming (like making peppers into roasted peppers dips), food additives (vitamins, minerals, preservatives, etc.) as well as producing boxes, cans, trays, cellophane wraps, glass jars… in short, everything that your food comes into.
Here, our pepper has to pass the aesthetic test again and meet precise specifications of colour, shape and size.
Another cause of surplus at this stage can be trimmings (peels and stems for example), production line inefficiencies (order fulfillment, machine operations) and excess inventory due to inappropriate forecasting. All in all, this stage represents a staggering 43% of avoidable food waste.
Once it made it through the factory, our pepper is on its way to you, either to your neighbourhood grocery store, restaurant, hotel or other foodservice location.
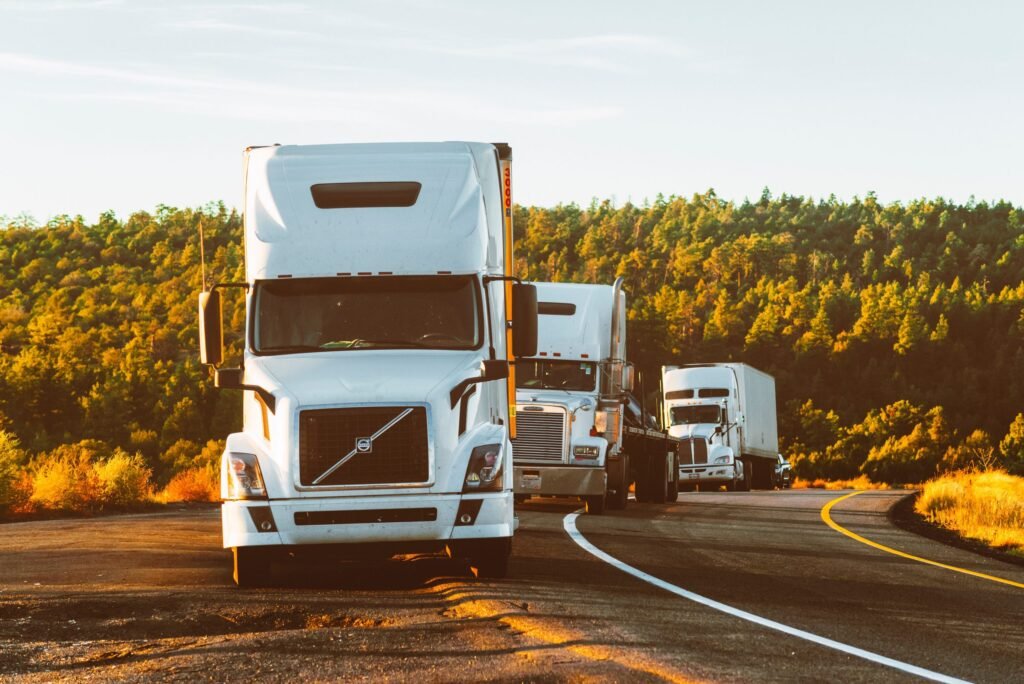
Transport and distribution account for 14% of the food chain’s energy inputs, mostly due to fuel consumption of ships and refrigerated trucks. Produce travels an estimated 2,400 km before being eaten, and it is therefore not surprising that transport can represent between 50 to 70% of its total carbon footprint.
Many hurdles can lead to our pepper being discarded or spoiled, like improper storage or handling, and shipment delays. That’s another 5% lost.
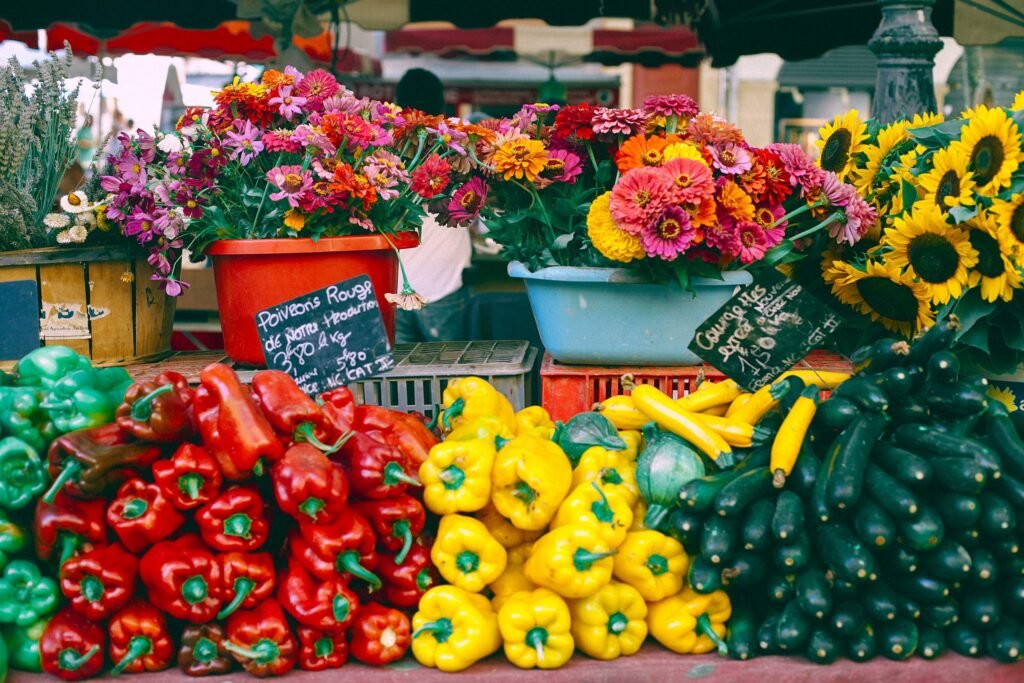
Our pepper is now at the grocery store, but it is still at risk of not going into your shopping basket, as about 12% of food loss and waste occurs here. For one, you might not select it because it is a little bruised or does not look perfectly shaped and red, or the store might remove it because it is past its prime freshness, even though it’s still perfectly edible. In fact, date labelling represents 50% of food waste in retail. Stock management is another significant factor when products are ordered in excess to ensure full shelves to satisfy customers’ expectations.

Hotels and restaurants are another user of whole or transformed food products and account for 12% of the total food waste, a large proportion of it coming from meals left on the plate by consumers, either due to large portions, buffets or personal preferences.
Food can also be wasted during preparation (trimmings or parts not being used), or because of poor menu design, when too many options are being offered to meet customers’ tastes.
Finally, our pepper is at your home, waiting to serve its purpose and be eaten.
Cooking, refrigeration and preparation can represent up to one-third of the total energy used in our food system, depending on the cooking method and the type of food being prepared.
In Canada, 21% of the food waste occurs at home, where products spoil due to unplanned or bulk purchases (over purchasing), improper food storage, or misconceptions about date labels.
How we can reduce our food waste
Identifying the causes of food loss and waste is the first step in making changes. An array of solutions are being developed at all levels of the supply chain, coming from governmental policies, social enterprises, non-profits organizations and individual actions.
We see gleaners who pick up surplus produce from farms, upcycling organizations who find a creative way to make tasty treats out of food by-products, imperfect produce being sold at a discount; we see awareness campaigns on date labelling; we see consumers changing their behaviour and planning better, buying local and eating less processed foods; we see better coordination and communication between food donors and recipients, improved tracking and impact measurement that drives discussions and change.
All of those actions, big and small, are what ultimately will get the food that took so much effort and energy to produce, on the table.
Written by Laura Mercy, Head of Finance at FoodMesh
Sources
- Eating Sustainably, 2010
- Net Zero Waste Council
- “Energy Smart” Food for People and Planet, FAO, 2011
- Project Drawdown, Reduced Food Waste, Technical Summary
- ReFed – What Causes Surplus; ReFed Insights Engine
- The avoidable Crisis of Food Waste, Value Chain Management International and Second Harvest, 2019


